
Our practical SEO reporting guides cover the context a traffic chart leaves out, because a chart alone can’t show whether a result came from the work or the market.
You’ve probably lived this moment. A client unmutes and asks, “So why did it go up?” The honest answer is a shrug.

That shrug traces back to a question many reports never ask: how much searching happened in the first place?
TL;DR

Traffic Went Up. Did Your Share of Search Demand?
A traffic number with no denominator invites the wrong conclusion in either direction. Growth reads as a win, a dip reads as a failure, and neither verdict has been checked against the market. The habit that fixes this in SEO monthly reporting is captured share: clicks on a fixed topic or query set, read against the demand signal for those same queries.
Here’s the monthly method:
- Lock the tracked query set for at least a quarter, ideally by grouping queries into topic clusters so each set maps to one priority theme.
- Use Google Search Console impressions as the demand signal for that set.
- Pull the same month from the prior year so seasonality shows up.
- State captured share in one sentence near the top of the report. Make it the first line stakeholders see.
Reading clicks against demand
| Clicks on tracked set | Impressions on tracked set | Likely reading and next check |
|---|---|---|
| Up | Up | Demand may be lifting everyone. Confirm captured share rose before crediting the work. |
| Up | Flat or down | Gains likely came from the work. Confirm with average position. |
| Down | Down | Demand or seasonality is the first suspect. Compare against the same month last year. |
| Down | Flat or up | Share is slipping. Check average position and recent site changes. |
A few things get fuzzy here. Impressions count how often someone saw a link to your site on Google, so they show demand as your site sees it, not the whole market (Google Search Console Help). Captured share here is clicks divided by impressions on the locked set, which is in effect the click-through rate for that set. Impressions and average position move together in telling ways: a query climbing from 12 to 8 while impressions and clicks rise is usually real progress, so read them side by side before drawing any conclusion (Screpy). Where you need a market-wide denominator, use third-party volume and label it as a modeled estimate. Swapping queries mid-quarter breaks the trend line.
Could you tell a stakeholder right now whether last month’s dip came from you or the market?
Picture a garden supply retailer (an illustrative example) reporting a winter dip in organic clicks. Its prior-year comparison on the locked query set shows impressions falling by a similar margin in the same months, with average position holding steady. The report calls the dip seasonal demand, keeps captured share as the headline, and skips the reactive content push someone was about to propose. Nobody has to spend a meeting defending a decline that the calendar caused.

What Monthly SEO Reporting Includes Once It Has to Explain Itself
A section earns its place by changing a decision or answering a recurring question. What monthly SEO reporting includes should follow from those recurring questions. That’s why the report centers on the SEO KPIs that matter and ignores most of what a tool can export.
Report sections and the question each one answers
| Report section | Question it answers | Data source |
|---|---|---|
| Demand context | Did searching for our topics rise or fall? | Search Console impressions on the fixed query set |
| Captured share | Did we win more of that demand? | Search Console clicks and impressions |
| Work shipped | What changed on the site this month? | Project tracker or CMS log |
| Decision log | Why did we make those calls, and what did we skip? | Team notes |
| AI answer citations | Do AI-generated answers cite our pages? | Dated manual or tool-based prompt checks |
| Next month’s bets | What are we doing next, and why? | Roadmap |
The decision log and AI citation rows get their own sections below. Plenty of standard pages fail the test above, and three are usually safe to cut:
- Full technical crawl exports. Report the changes and fixes, and leave the raw export in the tool.
- Backlink totals with no page context. Show the links earned by the pages that needed them.
- Ranking tables for unprioritized queries. Nobody asked about them, so nobody reads them.

Two details need more care. Conversion and revenue credit across channels shifts with the attribution model in GA4 (Google Analytics 4) (splinternetmarketing.com), so name the model in a footnote and keep any work on estimating enterprise SEO ROI as a separate, assumption-labeled exercise.
Branded and non-branded traffic tell different stories, too. A brand campaign can lift branded clicks while non-branded share quietly slides, and monthly SEO reporting that blends the two hides both movements. Split them wherever your data allows.
Which page of your current report would anyone miss if it vanished?
Write Down the Calls You Made (and the Ones You Passed On)
Many templates skip this page. A decision log gives each call one line. Each entry needs seven fields:
- Date
- Page or pages affected
- The change
- The reason
- Expected signal
- Check-back date
- Outcome (filled in later)
Example entries
Illustrative entries.
| Date | Page(s) | Change | Reason | Expected signal | Check-back | Outcome |
|---|---|---|---|---|---|---|
| Week 1 | Category pages | Rewrote title tags | High impressions, low clicks | Higher captured share on the tracked set | Six weeks out | Pending |
| Week 2 | Two overlapping guides | Deferred a merge | Cannibalization risk unclear; waiting on dev time | None yet | Next quarter’s planning | Deferred |
| Week 3 | Top product page | Added a question-and-answer block | Question queries showing impressions without clicks | More clicks on question queries | Next month’s report | Awaiting check-back |
Deferred work is the part teams overlook. Logging skipped items with a reason (low demand, cannibalization risk, budget, a wait on dev resources) puts your judgment on the record. It also stops the same idea from getting re-pitched every single month. Someone asks, “Why didn’t we do X?” and you point to a dated reason.
The payoff shows up in three places:
- Outcomes trace back to decisions. Each result links to the dated call that preceded it.
- Memory survives turnover. A new hire or a new agency inherits the reasoning along with the accounts.
- Stakeholders see reasoning. Activity shows effort; the log shows why the effort went where it did.
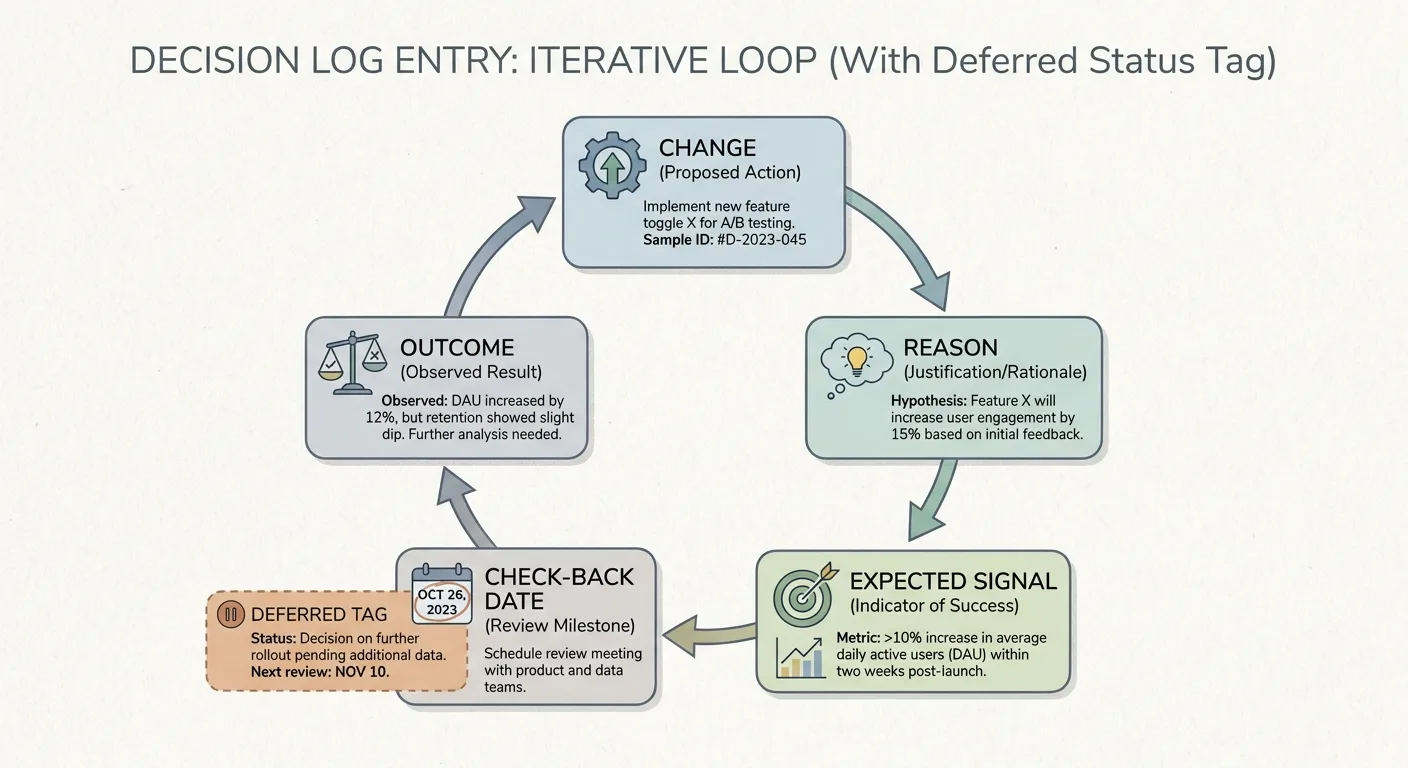
Keep the log honest about its limits. Several changes in one window muddy attribution, so note overlaps in the entry. An entry shows timing, not proof of cause. Limit each entry to one line, because a log that takes ten minutes per row stops getting updated by week three.
Clicks Don’t Show Every Answer That Quotes You
AI-generated answers can cite or summarize a page without anyone clicking through, so monthly SEO reporting built only on clicks and sessions may miss part of the picture. Knowing how AI visibility works helps teams choose prompts tied to their priority topics. The check itself stays small:
- Choose 10 to 20 prompts tied to priority topics. Treat that range as a starting point and adjust it to the time you have.
- Run them on a set date each month.
- Record whether your page is cited, and which domain gets cited if yours isn’t.
Use one record per prompt so every month reads the same way:
- Check date:
- Prompt (exact wording, unchanged month to month):
- Your page cited? (yes / no)
- Cited page or domain if not yours:
- Change since last check:
- Logged follow-up (link to decision log entry, if any):
The report itself needs one sentence plus a short list of citation gains or losses.
Wording matters here. AI search answers can vary across runs, prompts and time, making one-off observations unreliable (arxiv.org), so label every result as a dated sample. A single check can’t support a month-over-month conclusion. Citation without a click still carries value, though tying it to revenue is speculative, and the copy should say so plainly.
Do you know which competitor gets quoted on your most important topic? Say a B2B software team finds a competitor’s comparison page cited on its top prompt for two consecutive checks. The team logs an update to its own comparison page in the decision log with a check-back date, and the next report notes the result as a dated sample.

A Report Template People Read Past Page One
Everything above fits into one SEO monthly reporting template. Page one answers three questions:
- What happened
- Why it happened
- What we’re doing next
Copy this block into your next report:
- What happened: [captured share on the tracked set, plus the one change worth knowing]
- Why it happened: [demand context and the decision log entries that overlap the period]
- What we’re doing next: [one or two bets, each with a check-back date]
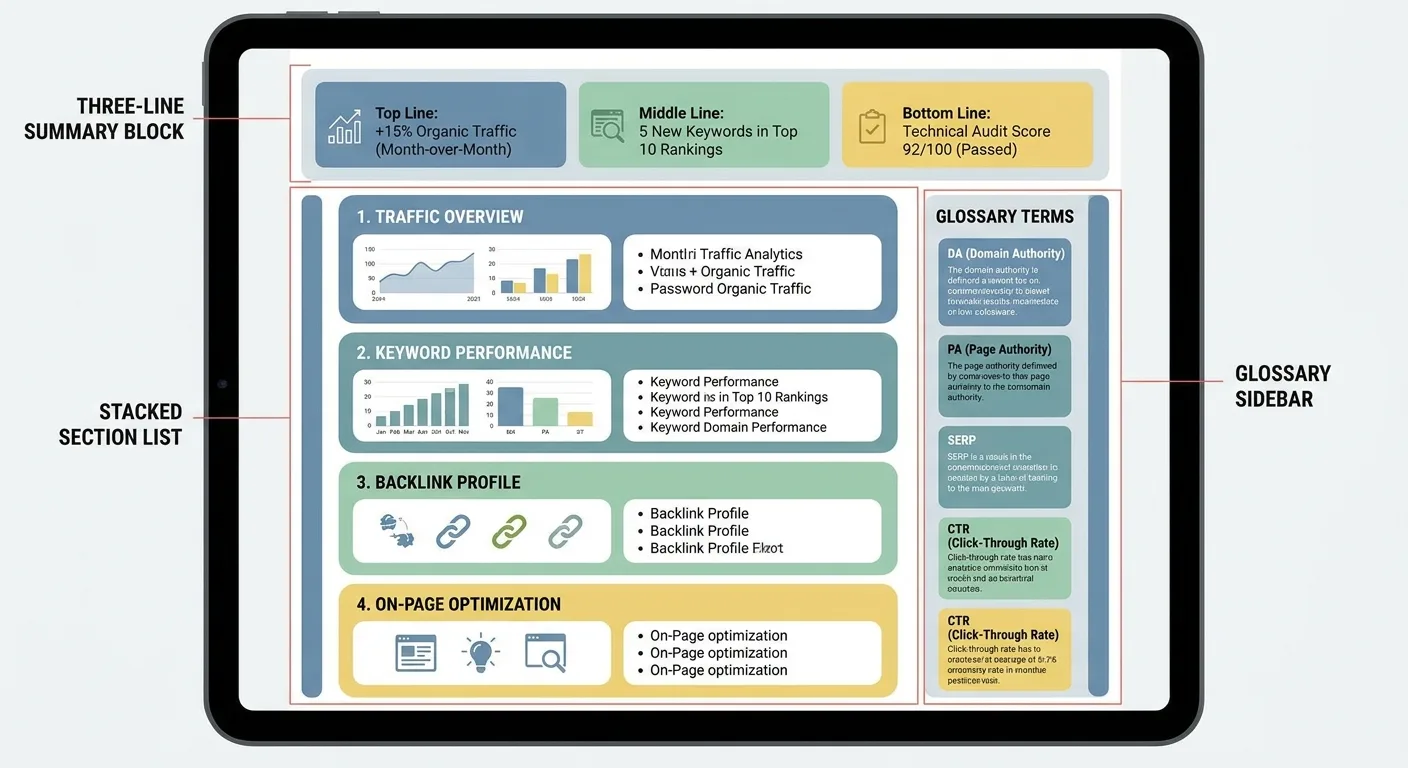
Specialist detail follows, in the section order from the earlier table. Anyone who wants a deeper technical layout can review a sample SEO audit report without bloating the monthly version. Close with a glossary appendix that defines each metric once, including captured share and average position.
Write page one for the least technical reader on the list. Specialists will jump to the sections they care about. Who on the distribution list stops reading after page one? (Write as if it’s most of them.)
Consistency keeps trends readable. Hold sections, query sets and date ranges steady, and mark any change to the monthly SEO report template with a version note and the date. Say an agency adds the AI answer citation section partway through a client engagement. The header changes to “Template v2” with the date of the change, and the first v2 report carries a one-line note that earlier months have no citation data.
Picking a Format Your Reader Will Open
Delivery format decides whether the report gets opened:
- PDF: An SEO monthly report PDF captures a fixed record, which suits sign-off, archiving and people who read in their inbox.
- Live link: A shareable link suits stakeholders who check progress between reports.
Three habits keep either format trustworthy:
- Stamp the date range on every export.
- Note that live data can shift after you send it.
- Control who can see which views.

Ending the Screenshot Shuffle at Month-End
Numbers come from Search Console in one tab and GA4 in another, charts get screenshotted into slides, and the deck is stale by the time the client opens it. That assembly is why many teams start automating SEO reporting instead of rebuilding the deck every month.

We built SEO reporting in Vee3.ai to handle that assembly, from measurement through reporting, with support for AI search. The platform covers crawling, research, planning, writing, fact-checking, publishing and measurement. The decision log and the reasoning behind each call stay with you, since the platform leaves every decision that matters in your hands. Start building free and put your hardest client’s report in it first.
Frequently Asked Questions
How long should a monthly SEO report be?
A monthly SEO report needs one summary page plus only the sections that answer a current question. Length should follow what changed that month, so quiet months produce shorter reports, and that’s acceptable. Supporting detail can move to an appendix, since readers rarely need every chart every month.
What do I put in a report for a month where rankings dropped?
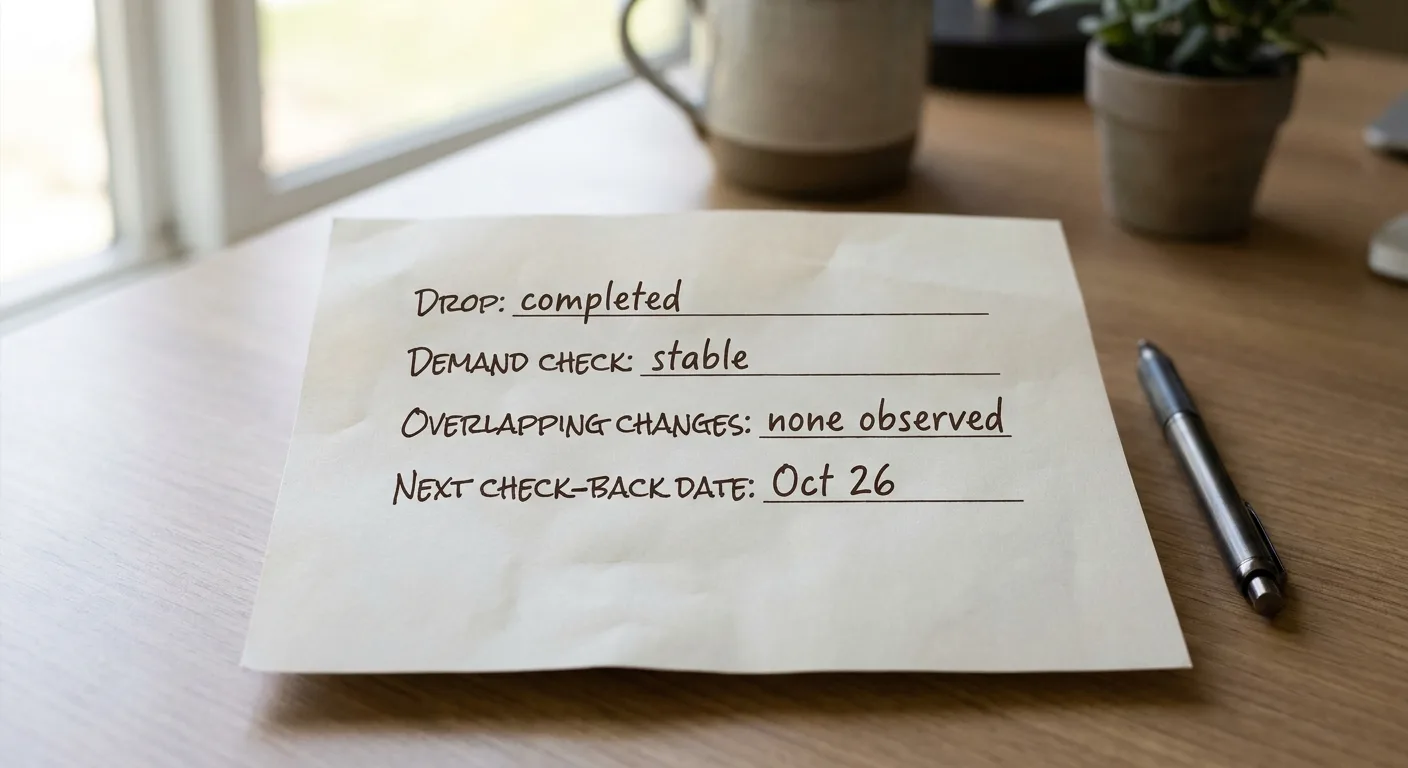
In a month where rankings dropped, lead with the drop, stated plainly, so the reader isn’t left to find it. Then check it against demand context and consistent rank tracking data before naming any cause, reference overlapping changes, and state your response with a check-back date. Never assign a cause the data can’t support; “under review” is a legitimate status.
Is monthly too often to report on SEO?
Monthly is rarely too often, because monthly SEO reporting keeps decisions logged and surfaces problems early. New pages, particularly on newer domains, often take three to six months to compete meaningfully in search (graig.net), so add a quarterly trend view that smooths short-term swings. The monthly report can also mark specific items as “too early to judge.”
Final Thoughts
Pick one change before your next send date. Add a single demand-context sentence near the top, and start a decision log with at least three entries from this month, one of them something you chose not to do. Three lines are enough to begin, and the format grows from there.
Monthly SEO reporting gets far easier to write once it explains the month as well as measuring it. The client question that used to earn a shrug gets an answer with a date attached.