
Your dashboard is green, traffic is up, and growth still feels flat. So what are SEO KPIs supposed to prove, if they can’t explain that?
Clicks, rankings and sessions, the metrics that fill most SEO reporting templates, only measure what a site already captured. None of them show how much available demand went unclaimed.
Most KPIs are numerators with no denominator. Suppose clicks rise 20% in a hypothetical quarter. That lift says nothing about the share of the market you hold.
You’ve probably presented a healthy-looking report and still walked out of the meeting uneasy.

The rest of this guide measures your numbers against everything searchers wanted.
Key Facts: Measuring SEO KPIs Against Total Demand
Rising Clicks, Shrinking Share: How Both Happen at Once
Absolute metrics climb for plenty of reasons unrelated to performance. Seasonal demand lifts every site in a category. The category itself can grow. New query variants enter the market and bring fresh impressions with them. Your clicks go up, and the report calls it a win.
The metric that catches this is share of addressable demand: captured clicks divided by the realistic click opportunity across every query cluster your site should own.
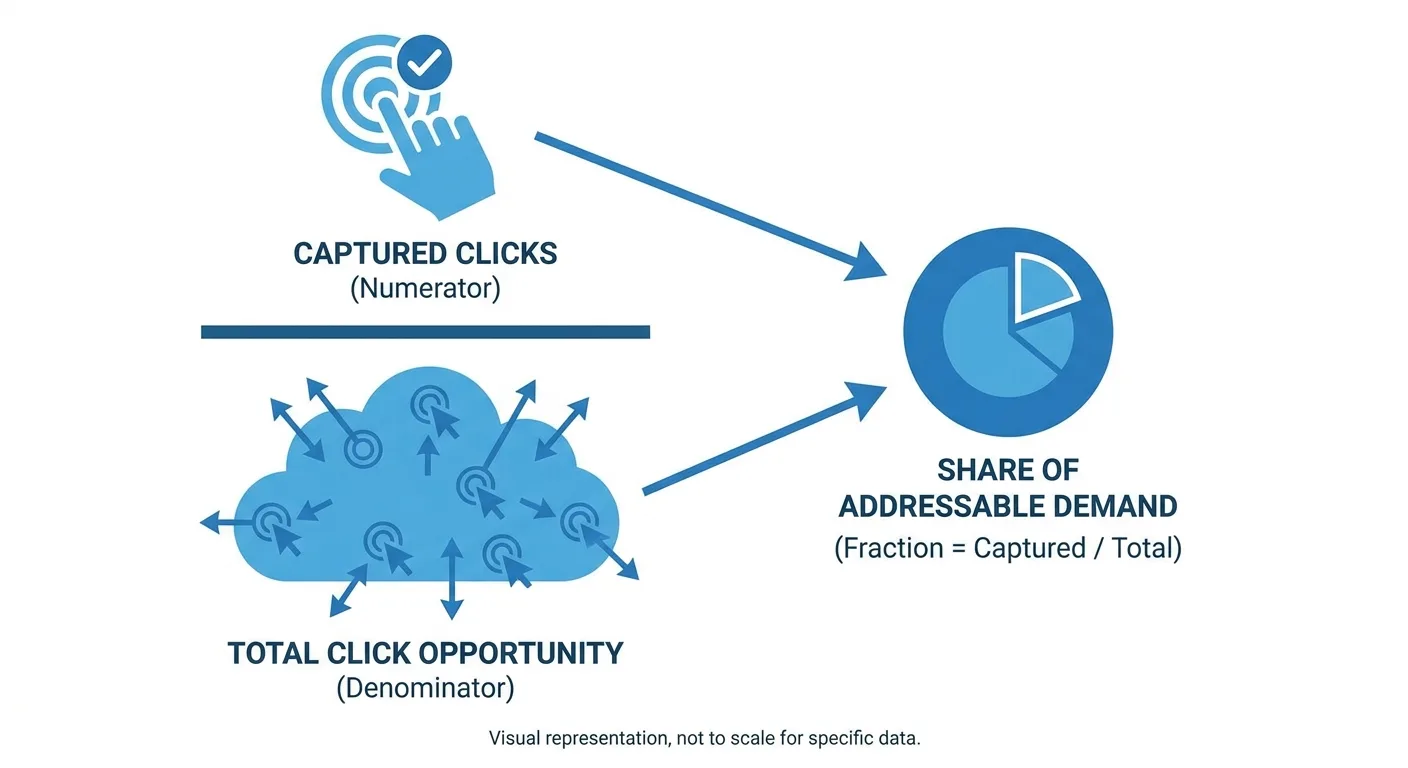
Express share as a percentage. Calculate captured clicks and click opportunity over the same date range, then compare like periods: quarter over quarter for most sites, or year over year for seasonal ones, so a spring peak never gets measured against a winter trough.
Picture a garden supply retailer that reports organic click growth every spring. Category demand rises with the season, so clicks climb on their own. A rival publishes guides covering a new cluster of raised-bed queries that same quarter, and the retailer has no page for any of them. Share of addressable demand exposes the decline the click report hides and names the missing cluster as the next page to build.
Illustrative model: organic clicks and share of addressable demand over four quarters
| Quarter | Organic clicks | Share of addressable demand |
|---|---|---|
| Q1 | Baseline | Baseline |
| Q2 | Rising | Holding steady |
| Q3 | Rising | Slipping |
| Q4 | Rising | Falling |
Illustrative model only, not real data.
Why don’t standard SEO KPIs flag this pattern? Many lists of top SEO KPIs stop at organic sessions, keyword positions and conversions, and all three are numerators. (Rankings still matter, and what rank tracking actually measures feeds share, but positions are inputs to share, not a substitute for it.)
Addressable demand is an estimate, and we want to be upfront about that. Search volumes are modeled ranges, so we watch the trend in share and treat no single figure as exact.
Building a Demand Baseline Before You Choose a Single Metric
Share needs a denominator, and this is where you build one. A credible baseline anchors every downstream metric in your set of KPIs for SEO.
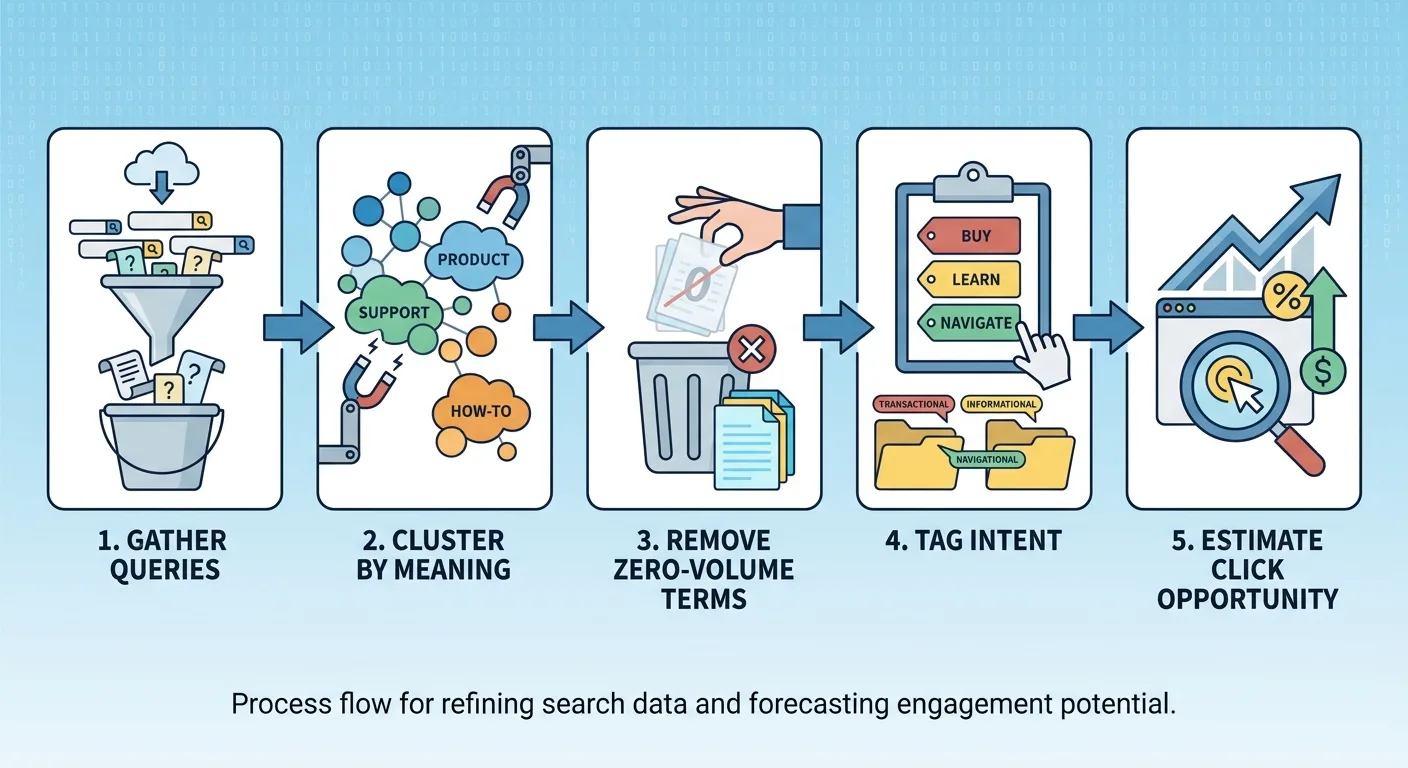
- Gather real queries. Pull every query the site already earns impressions for, plus seed topics it should own.
- Cluster by meaning. Group queries by intent instead of shared words. Two phrasings with one intent belong to one page.
- Strip out zero demand and duplicate intent. Remove zero-volume terms and merge duplicate intents so the baseline doesn’t inflate.
- Tag intent and page type. Label each cluster informational, commercial or transactional, then assign the page type that should serve it.
- Estimate click opportunity. Start from volume, then discount for the SERP features that absorb clicks before anyone reaches an organic listing.
Record each cluster as one row in this worksheet:
Cluster Baseline Worksheet (one row per cluster)
- Cluster name: the shared intent in plain words
- Representative queries: three to five real phrasings
- Intent: informational / commercial / transactional
- Page type: guide, category, product, comparison, glossary
- Mapped URL: the single owning page, or “gap” if none exists
- Estimated volume range: modeled low and high
- Click-absorbing SERP features: AI Overview, featured snippet, map pack, shopping
- Estimated click opportunity: volume adjusted for those features
- Captured clicks: from Google Search Console for the same period
- Share of addressable demand: captured clicks divided by click opportunity
- Cluster setting version: the tightness setting used
The discount in step 5 needs the same discipline as the clusters. Give each click-absorbing feature (AI Overview, featured snippet, map pack, shopping) a written discount assumption, apply those assumptions every cycle, and record them beside the cluster setting version. Revisit an assumption when the feature mix on a cluster’s results changes, and note when you did. Consistent assumptions matter more than perfect ones, because consistency keeps the share trend readable.
A worked example shows the math. If a cluster’s estimated click opportunity is 4,000 clicks a quarter and Search Console shows 600 captured clicks, share is 15% (hypothetical figures). Because volume is a modeled low-to-high range, run the calculation at both ends and report share as a range too.
Cluster tightness is a judgment call, and it changes the denominator. Tight settings split demand across many narrow pages. Broad settings fold it into a handful. Neither choice is wrong. Switching between them is, because the share trend breaks the moment the setting moves. Pick one and keep it stable.

This step feels slow, which makes it easy to skip. It’s also the step everything else depends on. (A spreadsheet works for small sites but strains past a few hundred clusters, which is where dedicated keyword clustering tools earn their place.)
Quiet Inflation: The Inputs Padding Your Numbers
An honest denominator can still sit under a polluted numerator. Most KPIs in SEO are only as clean as what got counted, which is why input hygiene belongs in broader technical SEO audits as well as in reporting.

Try this before your next report: count how many of your “competitors” turn out to be Amazon or Wikipedia. The table below lays out the technical SEO KPIs we’d add to correct that distortion and three others.
| Inflated input | How it distorts the KPI | Cleaner KPI to track | Hygiene rule |
|---|---|---|---|
| Internal link totals | Navigation, footer and sidebar links repeat site-wide and swamp editorial links | Editorial internal link coverage, plus orphan page count | Count in-content links only; exclude targets that appear across a large share of pages; flag orphans separately |
| Competitor sets | Marketplaces, directories and huge publishers rank everywhere and skew share of voice | Share of voice against keyword-overlap competitors | Score rivals by overlap with your clusters, not by who appears in results |
| Cannibalizing URLs | Two pages chasing one query make rankings look broader while each underperforms | Cannibalized query count | Assign one owner URL per cluster and track overlaps as their own KPI |
| Unmapped indexable pages | Pages with no cluster pad index counts without serving any demand | Indexable pages mapped to a cluster | Map or retire every indexable URL against the baseline |
Cannibalization deserves a concrete case. Say a SaaS company publishes a blog post and a glossary entry that both target “what is customer churn.” Search Console shows both URLs earning impressions for the query, and the rank tracker reports two positions, which reads as broader coverage. Neither page holds a strong position, since each splits the signals the other needs. Consolidating into one owner page and pointing internal links at it turns two weak rankings into one competitive one.
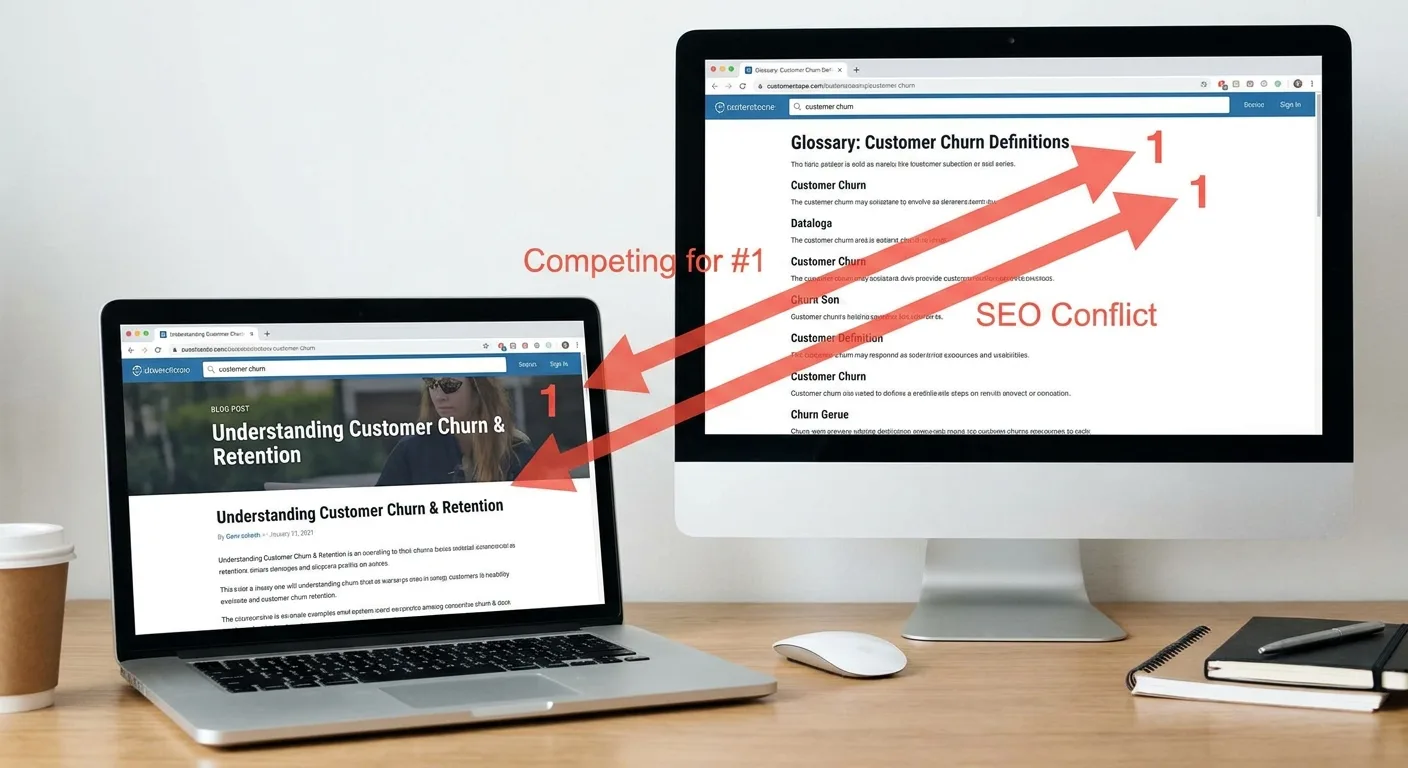
Every exclusion threshold here, from where template links start to how much overlap makes a rival real, is a judgment call. Document each one so trends stay comparable quarter to quarter.
AI Answers Deserve Their Own Scoreboard
A brand can shape an answer and earn zero sessions from it, which is the heart of what AI visibility really means for anyone reporting on search. Click-based metrics miss that entirely. We’d argue answer visibility belongs in the set of KPIs SEO teams report, measured against the same clusters you built earlier.

The core metric is AI citation rate: the share of tracked prompts in a cluster where your site gets cited. It tells you whether answer engines treat your pages as a reference for that intent.
Its companion is the cited-instead rate, which measures how often a competitor appears where you don’t. That second number drives planning. It names who’s winning the answer and which of their pages you need to beat.
Repeat answers often cite different sources: a weekly study found consecutive cited answers shared only 33.3% of their source hostnames on ChatGPT Search and 24.7% on Google AI Mode, so one run tells you very little (Parse).
AI Citation Sampling Checklist
- Reuse the clusters from the demand baseline and choose a fixed prompt set for each.
- Phrase prompts the way real searchers ask, with two or three variants per cluster.
- Run every prompt across several separate sessions, and across locations where possible.
- Log three fields per run: cited (yes or no), the cited URL, and any competitor cited instead.
- Report citation rate and cited-instead rate per cluster as a range across runs.
- Hold the prompt set constant between cycles and log any change beside the results.
Page structure helps too. Valid schema can make pages easier for answer engines to parse by explicitly stating what the content is, who published it and when it was updated, though it does not guarantee a citation (Search Atlas). Treat this area as unsettled; start rough and refine.
One SEO KPI Scorecard, Sliced by Role
Everyone works from the same baseline. What changes is the slice of the scorecard each person sees, so nobody drowns in numbers they can’t act on.
| Role | Core KPIs | Why it matters to them |
|---|---|---|
| SEO manager | Share of addressable demand, cannibalized queries, editorial link coverage, AI citation rate | Owns the inputs and needs early warning on hygiene and coverage gaps |
| Executive | Organic revenue, market capture trend, cost per acquired session | Decides budget and needs proof that organic wins market, not just traffic |
| SaaS growth lead | Organic trial or demo signups, pipeline by intent cluster, activation rate from organic users | Answers to pipeline targets across long sales cycles |
| Blended search team | Shared query clusters, paid and organic overlap, combined share of the SERP | Allocates spend across channels and needs one demand count |
SEO manager KPIs stay operational so hygiene problems surface before they reach a revenue line.
The executive row needs plain definitions. Market capture trend is share of addressable demand tracked over time. Cost per acquired session is organic program cost divided by organic sessions in the same period. GA4’s attribution settings are not neutral knobs: changing a lookback window from 90 days to 30 redefines the question, and GA4 will re-answer history under the new rules (mar-sci.com), so name the settings in the report.

SaaS SEO KPIs need a different emphasis. Long sales cycles mean raw signup counts hide which clusters produce customers. Pipeline attributed by intent cluster is the signal worth reporting, because it shows which topics bring buyers and which bring browsers. To build it, tag each trial or demo conversion with its landing page’s cluster, then group pipeline by intent. Compare cohorts by quarter, not by week, since deals take time to close.
Blended teams face their own trap. Shared clusters built from one shared keyword analysis keep SEO SEM KPIs from counting the same demand twice. Paid and organic both report against that single cluster list, overlap gets measured cluster by cluster, and combined share of the SERP uses the same click-opportunity denominator as organic share.
Automating the Share-of-Demand Workflow
The baseline and hygiene work above holds up, but repeating it by hand every month makes a strong case for automating recurring SEO reports. Pulling Search Console, GA4, ranking and backlink exports into one sheet, then calculating share of demand by intent manually, eats time meant for building pages.

Whatever tool you consider, check that it joins clicks, sessions and revenue to page type and intent, counts editorial internal links separately from template links, flags orphan pages, and tracks where answer engines cite you or a competitor. Vee3.ai is one option: a single workspace to crawl, research, plan, write, fact-check, publish and measure, built for SEOs and ready for AI search. You keep every decision. (The workflow in this guide still applies with any tool.)
Want to try it on your own site? Map your site in Vee3.ai and start building.
Frequently Asked Questions
Which are the best SEO KPIs for a site with very little traffic?
Leading indicators make the best SEO KPIs at low volume, because conversion data is too thin to read. Track impressions by cluster, the share of baseline clusters with a live page, and position trend on priority queries. Small samples swing wildly, so review monthly trends and skip weekly readings.
How often should I rebuild my demand baseline?
Refresh it quarterly for most sites, with an extra pass after a major product launch or category shift. New query variants keep appearing: Google’s John Mueller said that 15% of search queries Google sees are completely brand new (Search Engine Journal). Log any cluster-setting change beside the refreshed figures so readers can tell a method change from a market change.
Do SEO KPIs need to change across languages and markets?
The definitions stay the same, but each market needs its own baseline. Direct translation can miss local search behavior and language, and the presence and frequency of SERP features varies significantly between countries (advancedwebranking.com). For teams reporting KPIs de SEO in Spanish-speaking markets, the gap is easy to picture: a sneaker retailer translating English clusters word for word would miss that sneakers are called “tenis” in Mexico but “zapatillas” in Spain (Parrot).

How is share of addressable demand different from share of voice?
Share of voice weights your visibility across a tracked keyword set, while share of addressable demand divides captured clicks by modeled click opportunity in each cluster. The first shows how present you are in results. The second shows how much realistic demand you actually turned into visits.
Final Thoughts: Report the Gap Alongside the Gain
The distance between captured and available demand is one of the most useful numbers your team can report. It turns reporting from a defense of last quarter into a build list for the next one, because every unclaimed cluster points at a page you haven’t written yet.
The move we’d make this week: build the baseline for a single priority cluster, starting from picking the right priority keywords, then calculate share. Put that figure beside your usual SEO KPIs in the next report.
Share the first estimate even if it’s rough. Stakeholders who see the gap start asking what to build next, and that conversation beats another round of applause for a green chart.