Agencies
Send a client report in one click
Export the one-page PDF with KPIs, trends and an executive readout, or invite the client with View access to the Dashboard screen only.
An SEO dashboard where Search Console, GA4 and your content strategy are sliced together.
Free to start. No account or card needed.
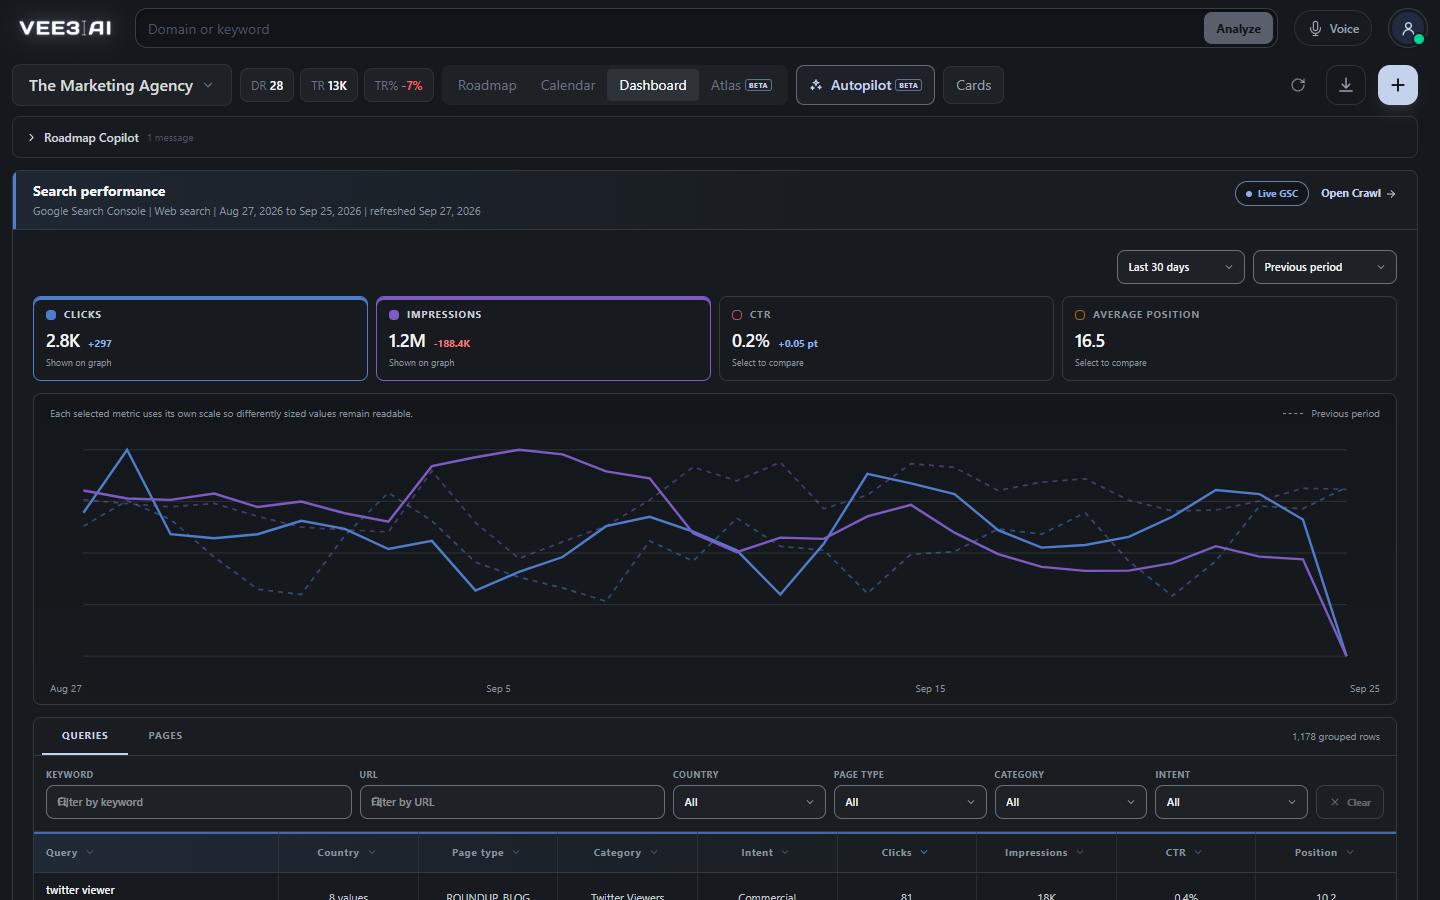
Clicks, impressions, CTR and average position from Search Console, with previous-period comparison and Queries and Pages tables.
Most dashboards tell you which URLs earned clicks. Vee3.ai's SEO dashboard tells you which kinds of pages earn them. Every page on your roadmap carries its page type, category and search intent, so the same Search Console and GA4 numbers can answer the questions a strategist actually asks: are guides or listicles earning more clicks, which category converts, and where is the next month of work best spent?
Connect Google Search Console and GA4 with read-only scopes. When one property matches your site it is connected automatically; when several do, you choose. The search chart plots Clicks, Impressions, CTR and Average position, and the analytics chart plots organic Sessions, Conversions, Conversion rate and Revenue. Toggle any metric onto the same chart, each on its own scale, and compare the last 30 days or 3, 6 or 12 months against the previous period, drawn as a dashed line.
Below the charts, Queries and Pages tables can be filtered by keyword, URL, country, page type, category and intent. That turns a flat export into an answer: filter to commercial intent in one category and you see exactly which pages carry revenue.
The Pipeline and performance card groups your whole roadmap by page type, category or keyword intent. For each group it shows delivery status (live, planned, in production, done, failed) next to average position, clicks, CTR, search volume, average DR, average KD and Capture, the clicks you earn as a share of that group's search volume. Planned pages sit beside live ones, so you see where demand is still unclaimed, not only what already ranks.
Competitor intelligence reuses the shortlist you saved in Brand Configuration, chosen by search overlap, and shows each rival's authority, traffic, pages, overlap and share of traffic, with your own brand in the same table. When you want their best keywords, Generate competitor keywords pulls the top terms for up to five rivals and marks each one On roadmap or Review topic. It runs only when you click, and the result is reused for seven days. For deeper research, open the full SEO competitor analysis tool.
The Technical checklist runs 15 checks from the evidence your last site crawl already stored: sitemap discovery, crawl coverage, indexability, HTTP responses, canonical consistency, title tags, primary headings, meta descriptions, structured data, supporting headings, broken internal links, internal discoverability, backlink coverage (once backlink data exists), thin page content and HTTPS internal links. Each check shows its status, priority and affected pages, with a CSV of the evidence. Opening the dashboard never crawls a page or calls a provider.
Roadmap warnings sit alongside it: failed workflows, duplicate keywords, competing pages, pages with no measured demand, empty clusters, pages outside their cluster and off-brand clusters. Each links straight to the roadmap or Topics view where you fix it.
Download the view as a one-page PDF: organic clicks, organic sessions, search capture and organic revenue, two trend charts and an executive readout, ready for a client email. To give a client the live view instead, share the workspace with View access on the Dashboard screen only; view-only users never see the Copilot or the AI Editor. For the big picture in three dimensions, send them the topical authority map.
In one real workspace, the dashboard showed 2,766 Search Console clicks in 30 days, up 297 on the previous period, from 1.2 million impressions, alongside 4,121 GA4 organic sessions, in one view with the content plan behind them.
See what each type of page earns you
Start in a guest workspace with no account or card; Google access is read-only and you can connect it whenever you are ready.
Google Search Console and GA4 with read-only scopes; matching properties are connected automatically.
Choose a range and a comparison period, then toggle metrics onto one chart.
Group performance by page type, category or intent.
Work the roadmap warnings and technical checklist, with affected pages and CSV evidence.
Agencies
Export the one-page PDF with KPIs, trends and an executive readout, or invite the client with View access to the Dashboard screen only.
Content leads
Group performance by page type and see whether guides, comparisons or category pages convert.
Technical SEOs
Filter the checklist to issues, expand a check to see the affected URLs, and download the evidence as CSV for the developer ticket.
It is one screen that brings together the numbers you use to judge organic search: clicks, impressions, rankings, organic sessions and conversions, usually with technical health and competitors. Vee3.ai adds your content plan, so every metric can be grouped by page type, category and intent.
At minimum, search performance, organic analytics and a way to spot technical problems. Vee3.ai's has seven cards: Search performance, Website analytics, Pipeline and performance, Competitor intelligence, Competitor top keywords, Roadmap warnings and Technical checklist. The Cards menu hides the ones you don't use.
Add the site, run a crawl and connect Search Console and GA4. The dashboard builds itself from that data and your roadmap, with nothing to configure. Until Google is connected you see a stored scan snapshot instead of date controls and trend lines.
No. Vee3.ai asks only for the read-only scopes webmasters.readonly and analytics.readonly, so it can read Search Console and GA4 but not edit them. If Google is authorized but no property is chosen, pick it on the Crawl screen.
From the competitor shortlist saved in Brand Configuration; the Dashboard reuses it without running competitor discovery again. Generate competitor keywords runs only when you click it, needs at least one monitored competitor, and the result is reused for 7 days.
The checklist uses your latest stored site scan, so it stays empty until a scan has run; Open Crawl takes you there. Once it has data, you can filter checks by issue, warning or passed, and expand a check to see its stored evidence.
Yes. Invite the client and give them View access to the Dashboard screen only; view-only users never see the Copilot or the AI Editor. Or download the one-page PDF, which includes every card even if you have hidden some.
Start a workspace without an account and watch the roadmap build itself. Save it to an account whenever you are ready.