
Many calculators price only the pages a team plans to build. Enterprise sites carry thousands of URLs that cost money to maintain, and plenty of them earn nothing at all.
Finance pushback often traces back to a missing cost column, not to weak SEO work. The spreadsheet leaves out the upkeep bill. (This isn’t a case for mass deletion.)

TL;DR
The Cost Column Nobody Fills In
A typical SEO ROI calculator works on a short chain: how many people search, how many click, how many buy and what they spend, minus what the content cost. Any SEO calculator designed for a quick web visit keeps its inputs short. That suits a campaign estimate, but not a portfolio.
Guides such as Omnius’s SaaS SEO ROI calculator guide frame the decision as whether to invest in SEO in 2026. A common way to express that chain uses search volume, click-through rate, conversion rate, average order value and monthly SEO cost:
(monthly searches × CTR × conversion rate × AOV minus monthly SEO cost) ÷ monthly SEO cost
Every one of those inputs points forward. None of them captures the upkeep of pages a site already owns.
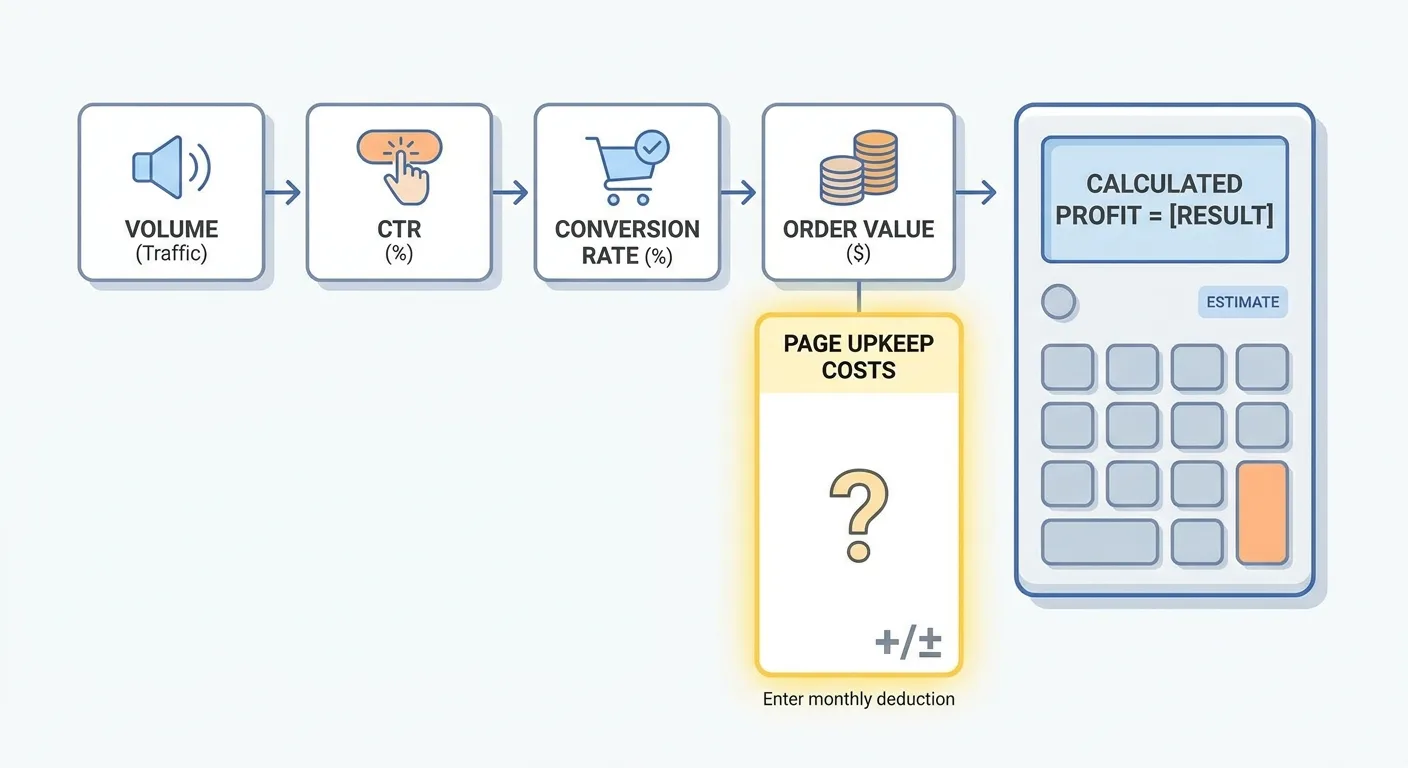
That upkeep usually includes:
- Legal and compliance review on regulated or claim-heavy pages
- Translation and localization for every market version
- CMS and hosting overhead that scales with URL count
- Scheduled refreshes to keep facts, screenshots and pricing current
- Dev tickets for template fixes that touch thousands of pages at once
Start with two questions. How many indexed URLs earned even one organic click last quarter? And which team pays to maintain them?
An inventory pass modeled on a sample SEO audit report surfaces those idle URLs before anyone argues about who foots the bill. (Some zero-click pages still do real work for customers, sales or regulators. Tag those as non-SEO assets and keep them out of the waste pile.)

Tool defaults rarely ask about existing pages. An enterprise SEO ROI calculator that skips this column therefore measures a campaign, not a program.
Rebuilding the SEO ROI Formula Around Page Inventory
The rebuilt SEO ROI formula reads:
(incremental organic gross profit minus fully loaded SEO cost) ÷ fully loaded SEO cost
“Incremental” means growth above a baseline. That baseline accounts for seasonality and for the momentum your pages already had, for example the same period last year, adjusted for trend. Raw totals flatter peak months and punish slow ones.
“Gross profit” means margin-adjusted revenue. Subscription businesses should swap in contract value adjusted for lifetime value. Teams already planning SEO for SaaS businesses will recognize why that adjustment matters. Finance, not the SEO team, signs off on the LTV assumptions.
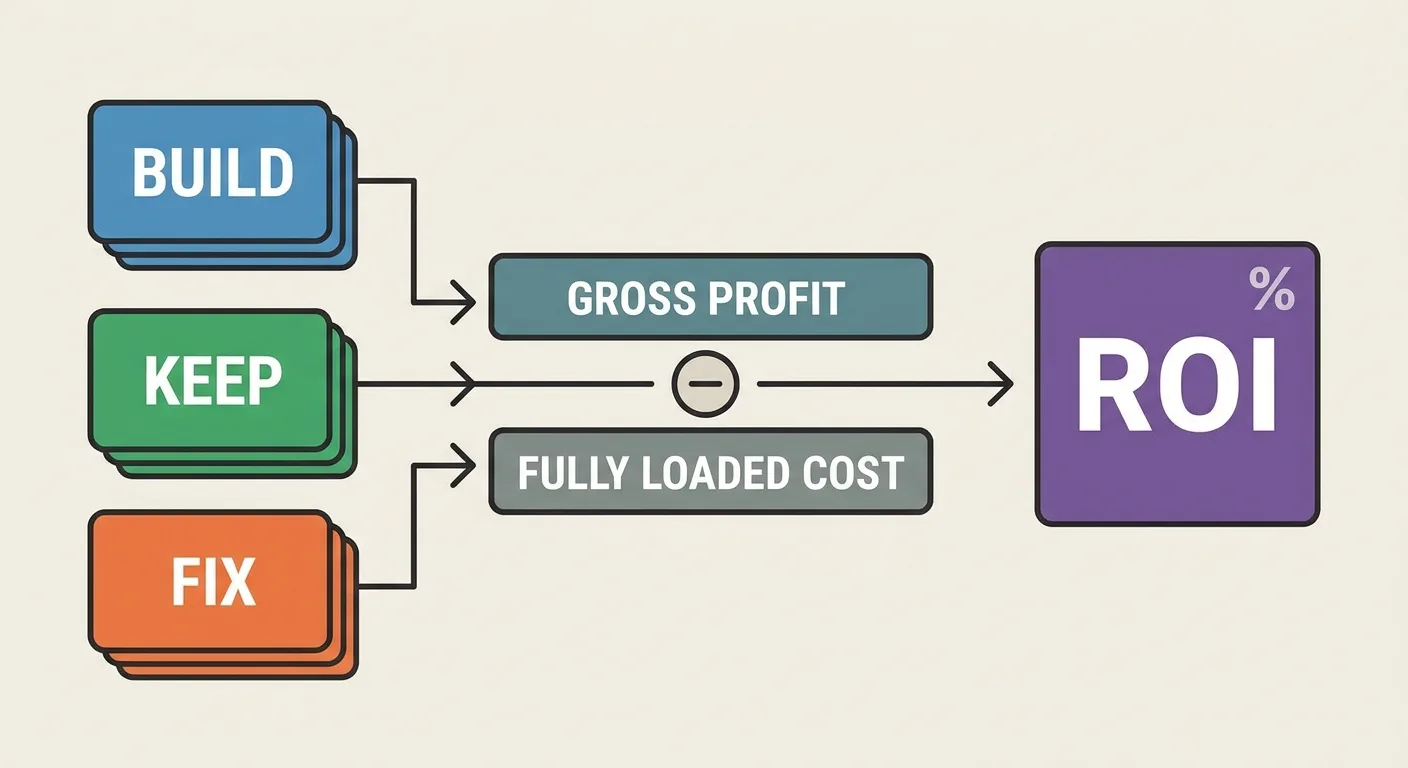
Cost then splits into three ledgers inside an enterprise SEO ROI calculator:
- Build: new pages.
- Keep: maintenance of existing pages.
- Fix: technical work, consolidation and redirects.
Each ledger is fully loaded. Salary share, agency fees, tool seats, engineering hours and content operations all count.
Ledger worksheet
| Input | Ledger or side | Where the data lives | Common error |
|---|---|---|---|
| Incremental clicks | Return side, all ledgers | Search Console page-level export | Using raw totals with no seasonal baseline |
| Conversion rate by page type | Return side, all ledgers | Analytics segmented by page type | Applying one sitewide rate to every template |
| Gross margin | Return side, all ledgers | Finance or ERP reporting | Plugging in revenue where margin belongs |
| Salary share | Build, Keep and Fix | Payroll data plus time allocation | Counting SEO headcount only and leaving out writers and reviewers |
| Agency fees | Build, Keep and Fix | Agency invoices and statements of work | Booking the whole retainer to Build |
| Tool cost | Keep | Procurement and license records | Missing seats billed to other teams |
| Dev hours | Fix | Engineering ticket system | Hours logged under generic “maintenance” |
| Refresh cost | Keep | Content calendar and agency invoices | Treating refreshes as free |
| Review and localization cost | Keep | Legal, compliance and localization vendor invoices | Costs billed to other departments and never counted |
| Consolidation cost | Fix | Redirect maps, dev tickets and QA time | Leaving out the temporary traffic dip |
Turning the Worksheet Into a Range Finance Will Sign
A single number invites a single argument. Set up the enterprise SEO ROI calculator to output a low, expected and high range instead. Build the range by varying three inputs: ranking probability, conversion rate and time to rank (in months).
Assign ranking probability by keyword difficulty band, using your rank tracker’s difficulty scale. Ground each band in consistent rank tracking data from your own pages, and label the resulting probability plainly as an estimate.
Group pages by publish month, too. Cohorts make lag visible, so a January page and a September page stop sharing one optimistic timeline.
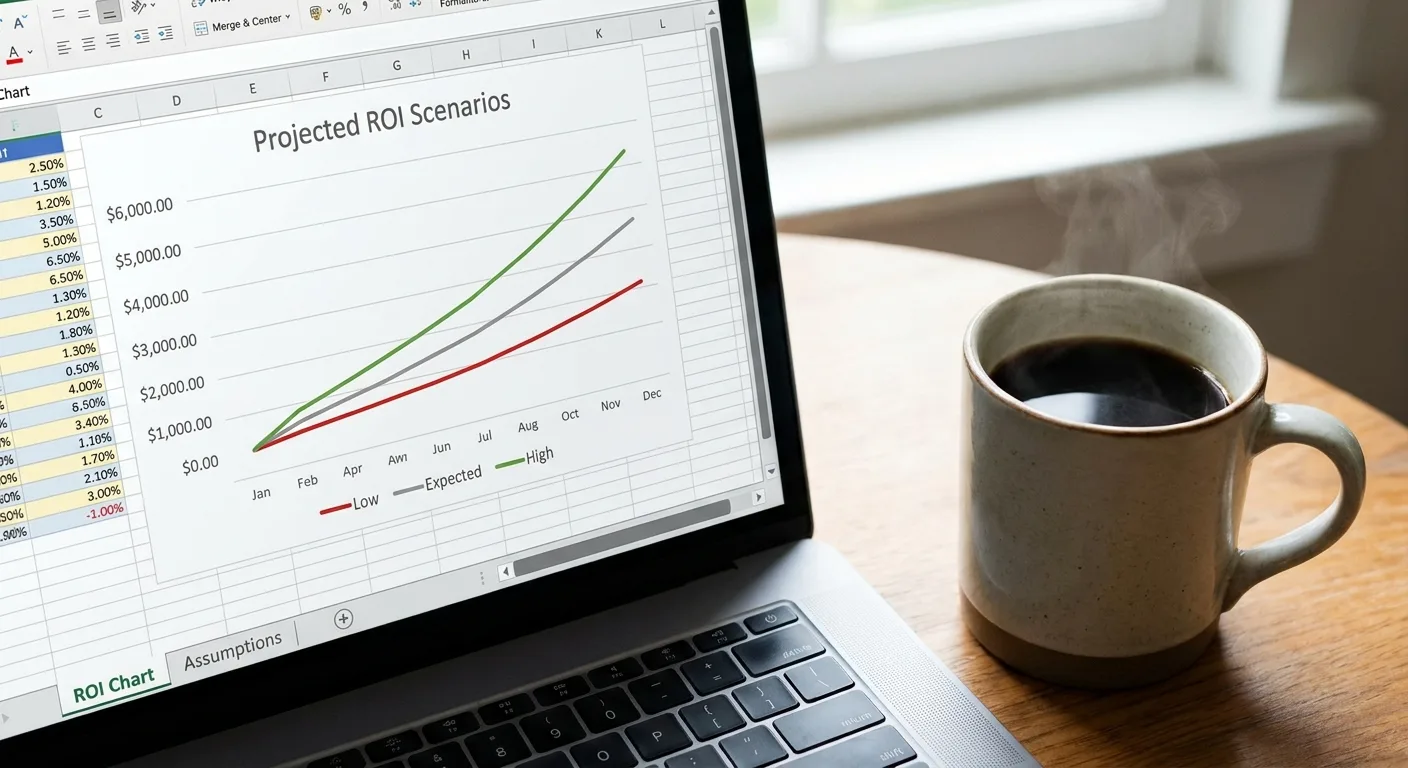
SearchPilot’s SEO Testing ROI Calculator shows what stated inputs look like in a working tool. The calculator asks for your traffic and what a session is worth, then has you pick the testing pace that fits your team (SearchPilot). Your model should be just as explicit about what goes in. Keep every input editable, so the whole model recalculates when a reviewer changes one.
Copy this assumption log into one visible tab, with one entry per assumption:
- Assumption: (e.g., ranking probability for mid-difficulty terms)
- Low / Expected / High value:
- Basis: internal cohort, team estimate or finance input
- Owner:
- Last reviewed:
Pick a horizon in months that your team will defend in a review, and write it down. Don’t quote a “typical” timeline as fact.
Pricing the Drag: Cannibalized, Dead and Decaying Pages
An SEO cost calculator usually adds up spend. This section adds up losses, specifically the ones hiding inside pages you already publish.
Drag reference table
| Drag source | Ledger | How to estimate | Data needed |
|---|---|---|---|
| Cannibalization | Fix | Estimate the clicks the stronger URL would likely hold alone, then log the consolidation work | Query-level clicks for competing URLs, intent mapping |
| Zero-demand pages | Keep, or flag for retirement | Count full production and upkeep cost against zero possible organic return | Search volume per target query, page cost history |
| Decay | Keep (refresh), plus opportunity cost | Price the refresh, then price the gross profit lost from quarter-over-quarter click decline | Quarterly page-level clicks, margin by page type |
| Template-inflated internal links | Fix | Price the editorial linking work needed to reach key pages that menus and footers mask as linked | Crawl data separating template links from in-content links |
Template links need one extra note the table can’t hold. Before you price that Fix line, weigh the editorial hours against automated internal linking workflows.
Decay also needs an honest baseline. SearchPilot’s SEO Testing ROI Calculator models a year against the counterfactual where you ship nothing. That turns the do-nothing scenario into an explicit line instead of an unstated assumption. Build the same line into your model. Pages that nobody touches rarely hold their clicks indefinitely, so a flat baseline isn’t a safe one.
For consolidation, model the short post-redirect trough before the gain appears. Treat every drag figure as directional, and mark it that way in your enterprise SEO ROI calculator.

Revenue Attribution That Survives a CFO’s Questions
Organic revenue gets attacked from two sides: optimists overclaim it and skeptics undercount it. Page-level data narrows both errors.
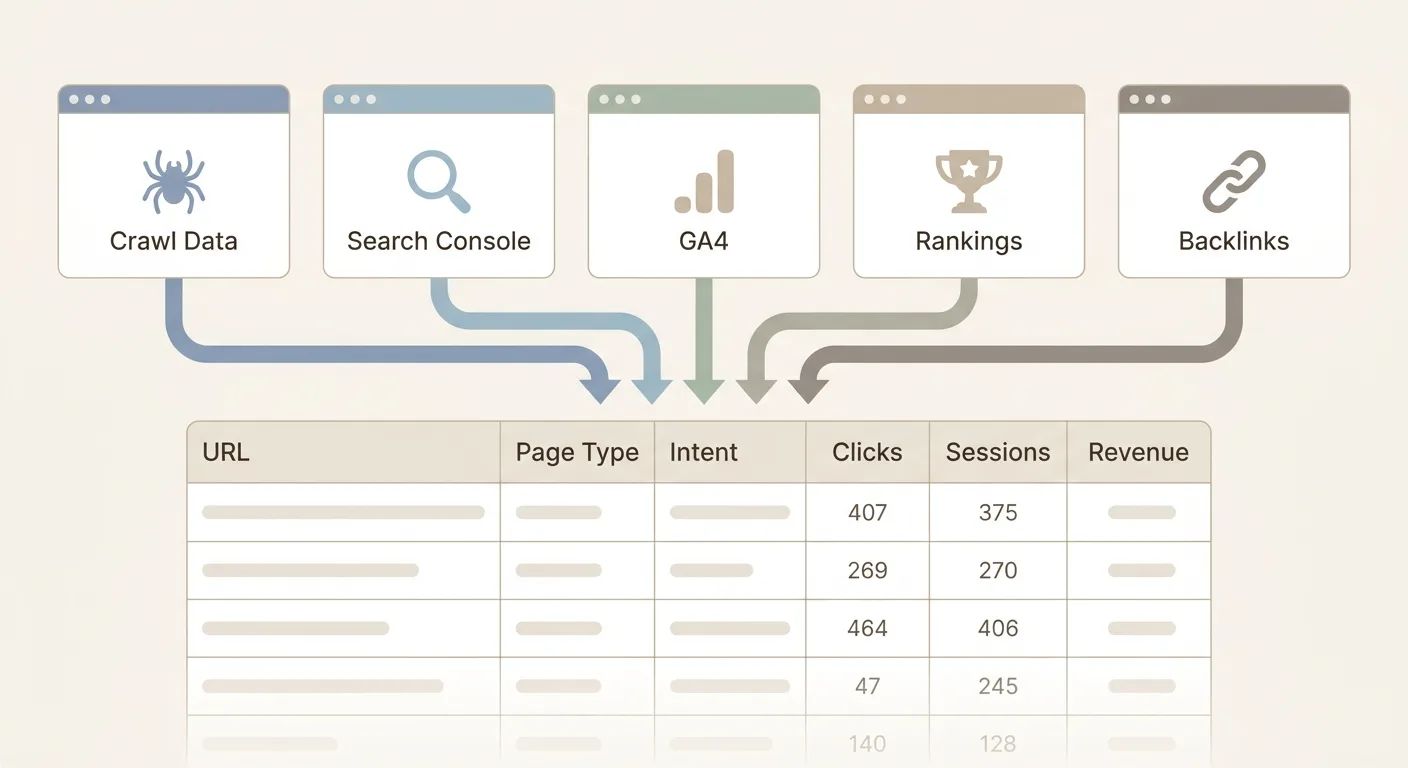
Start at the URL. Join query and click data from Search Console with session and conversion data from analytics. Then group the result by page type (product, category, guide) and intent. That grouped view feeds the enterprise SEO ROI calculator.
Branded queries get their own line. TV, PR and paid campaigns all push demand into branded search, so count only the incremental share you can defend.
Citations in ChatGPT or Google AI Overviews matter for visibility. Log them as a visibility line, using a framework for measuring AI search visibility, and leave the dollar column empty. (Putting a price on them today means guessing.)
Agree on these rules in writing before the model runs:
- Attribution window stated in days, plus the named attribution model.
- Branded query treatment: excluded, or an incremental share with the method written down.
- Assisted conversion credit rule, defined once so it stops being renegotiated.
- Page type and intent taxonomy used for grouping.
- AI answer citations treatment (visibility line only).
- Finance owner who signs off on the rules.
Attribution fights wear everyone out. Written rules head off many of them.

One shortcut deserves a warning. Teams sometimes reuse an ROI calculator built for paid ads, mostly because it already sits in a shared drive. Its logic assumes costs stop when spend stops. SEO costs land up front, and pages keep needing upkeep long afterward. The paid-ads template therefore books costs in the wrong period.
What Published ROI Benchmarks Can and Can’t Tell You
Big headline figures make budget decks easier to write. Published SEO ROI statistics mislead for a handful of reasons:
- Self-reported surveys with no audit behind the answers
- Undisclosed formulas, so you can’t tell whether revenue or profit sat on top
- Survivorship, since teams with poor results rarely volunteer them
- Mixed business models lumped into one pool
An average ROI on SEO is an average of incompatible calculations. One respondent may divide revenue by agency fees while another divides profit by total team cost, and the blended number carries neither method.

This section deliberately cites no outside figure. Instead, benchmark each new cohort against earlier cohorts of the same page type, using the SEO KPIs for cohort comparisons your team already reports. Your own history shares your margin, your domain maturity and your sales cycle. (If leadership insists on an outside figure, cite its method right next to it.)
Getting Page-Level Inventory Data Without the Export Marathon
Every enterprise SEO ROI calculator hits the same wall at the inventory ledger. The data sits in several tools, and exports eat time.
Vee3.ai’s crawl-to-rank workspace brings crawling, research, planning, writing, fact-checking, publishing and measurement into one workspace. Work through the inventory in this order:
- Crawl only the site sections you’re modeling, and use the results as the page list for the Keep and Fix ledgers.
- Filter zero-demand and duplicate targets during planning, using the logic covered in our guide to keyword clustering tools, so dead targets never reach the Build ledger.
- Measure page-level results each quarter, then feed them back into the model grouped by page type and intent.
Start building and map your existing pages before forecasting new ones.
Frequently Asked Questions
What is ROI in SEO when you manage thousands of pages?
At enterprise scale, ROI is the return on the whole page portfolio, not on a single campaign. Measure it per page type and publish cohort, so lagging pages can’t hide behind strong ones. Existing pages belong in the cost base, because they keep drawing budget whether or not they earn anything.
Is there an average ROI on SEO I can plug into a forecast?
No. Published figures rarely transfer, because margin, sales cycle and survey methods vary from one company to the next. Your prior cohorts of the same page type give you a baseline built on your own economics, which makes the forecast easier to defend. Any outside figure needs its method shown beside it.
How often should we rerun an enterprise SEO ROI calculator?
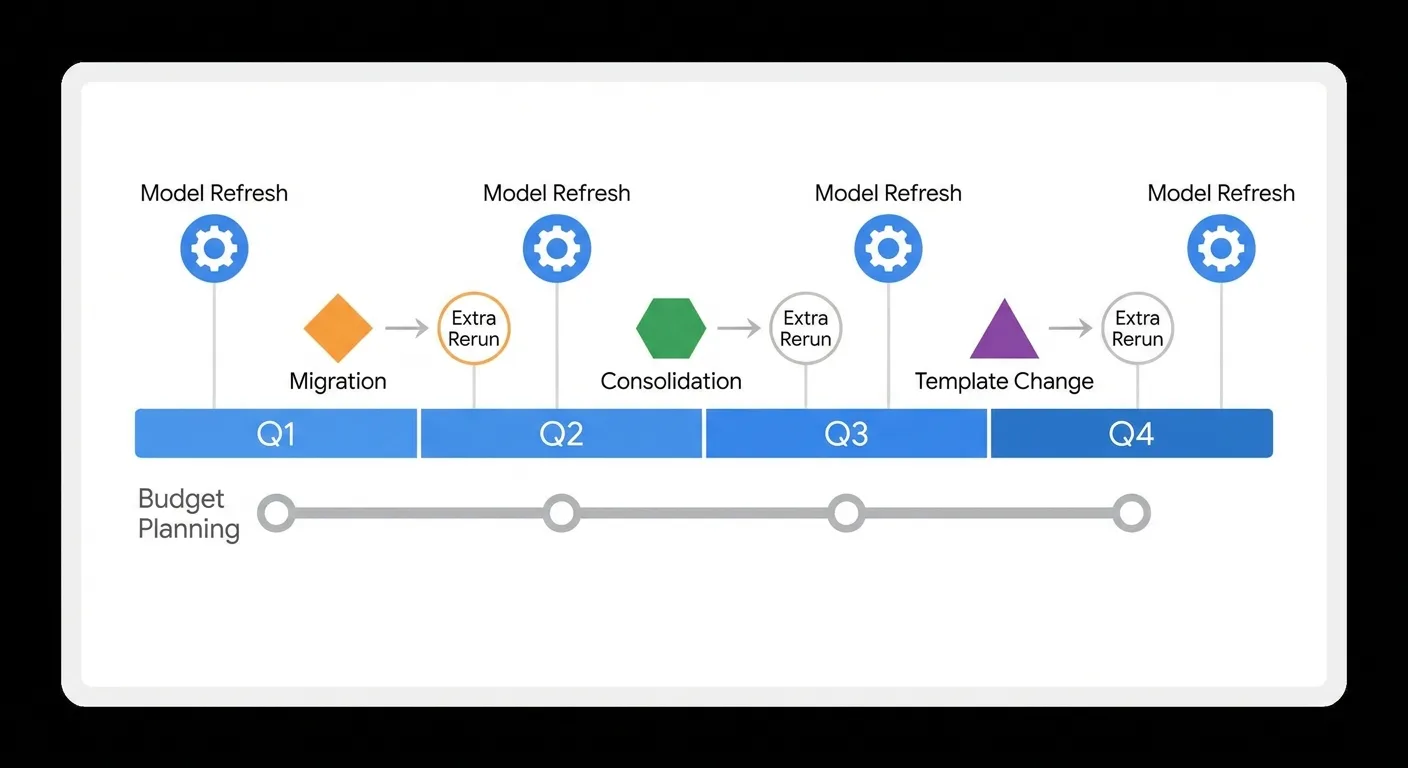
We recommend a quarterly refresh timed to budget planning, plus a rerun after any major migration, consolidation or template change. Update the drag items every cycle, since decay and cannibalization shift as pages age. Teams that automate recurring SEO reporting can refresh those inputs each quarter without starting a new round of exports.
Final Thoughts
Rebuild the model before your next budget cycle, and change the order of its tabs. Open the enterprise SEO ROI calculator with the Keep and Fix ledgers, then layer the Build forecast on top of that baseline.
Monday’s job is simple, if a little tedious. Pull last quarter’s page-level clicks and revenue, then tag every URL as earning, drag or non-SEO asset.